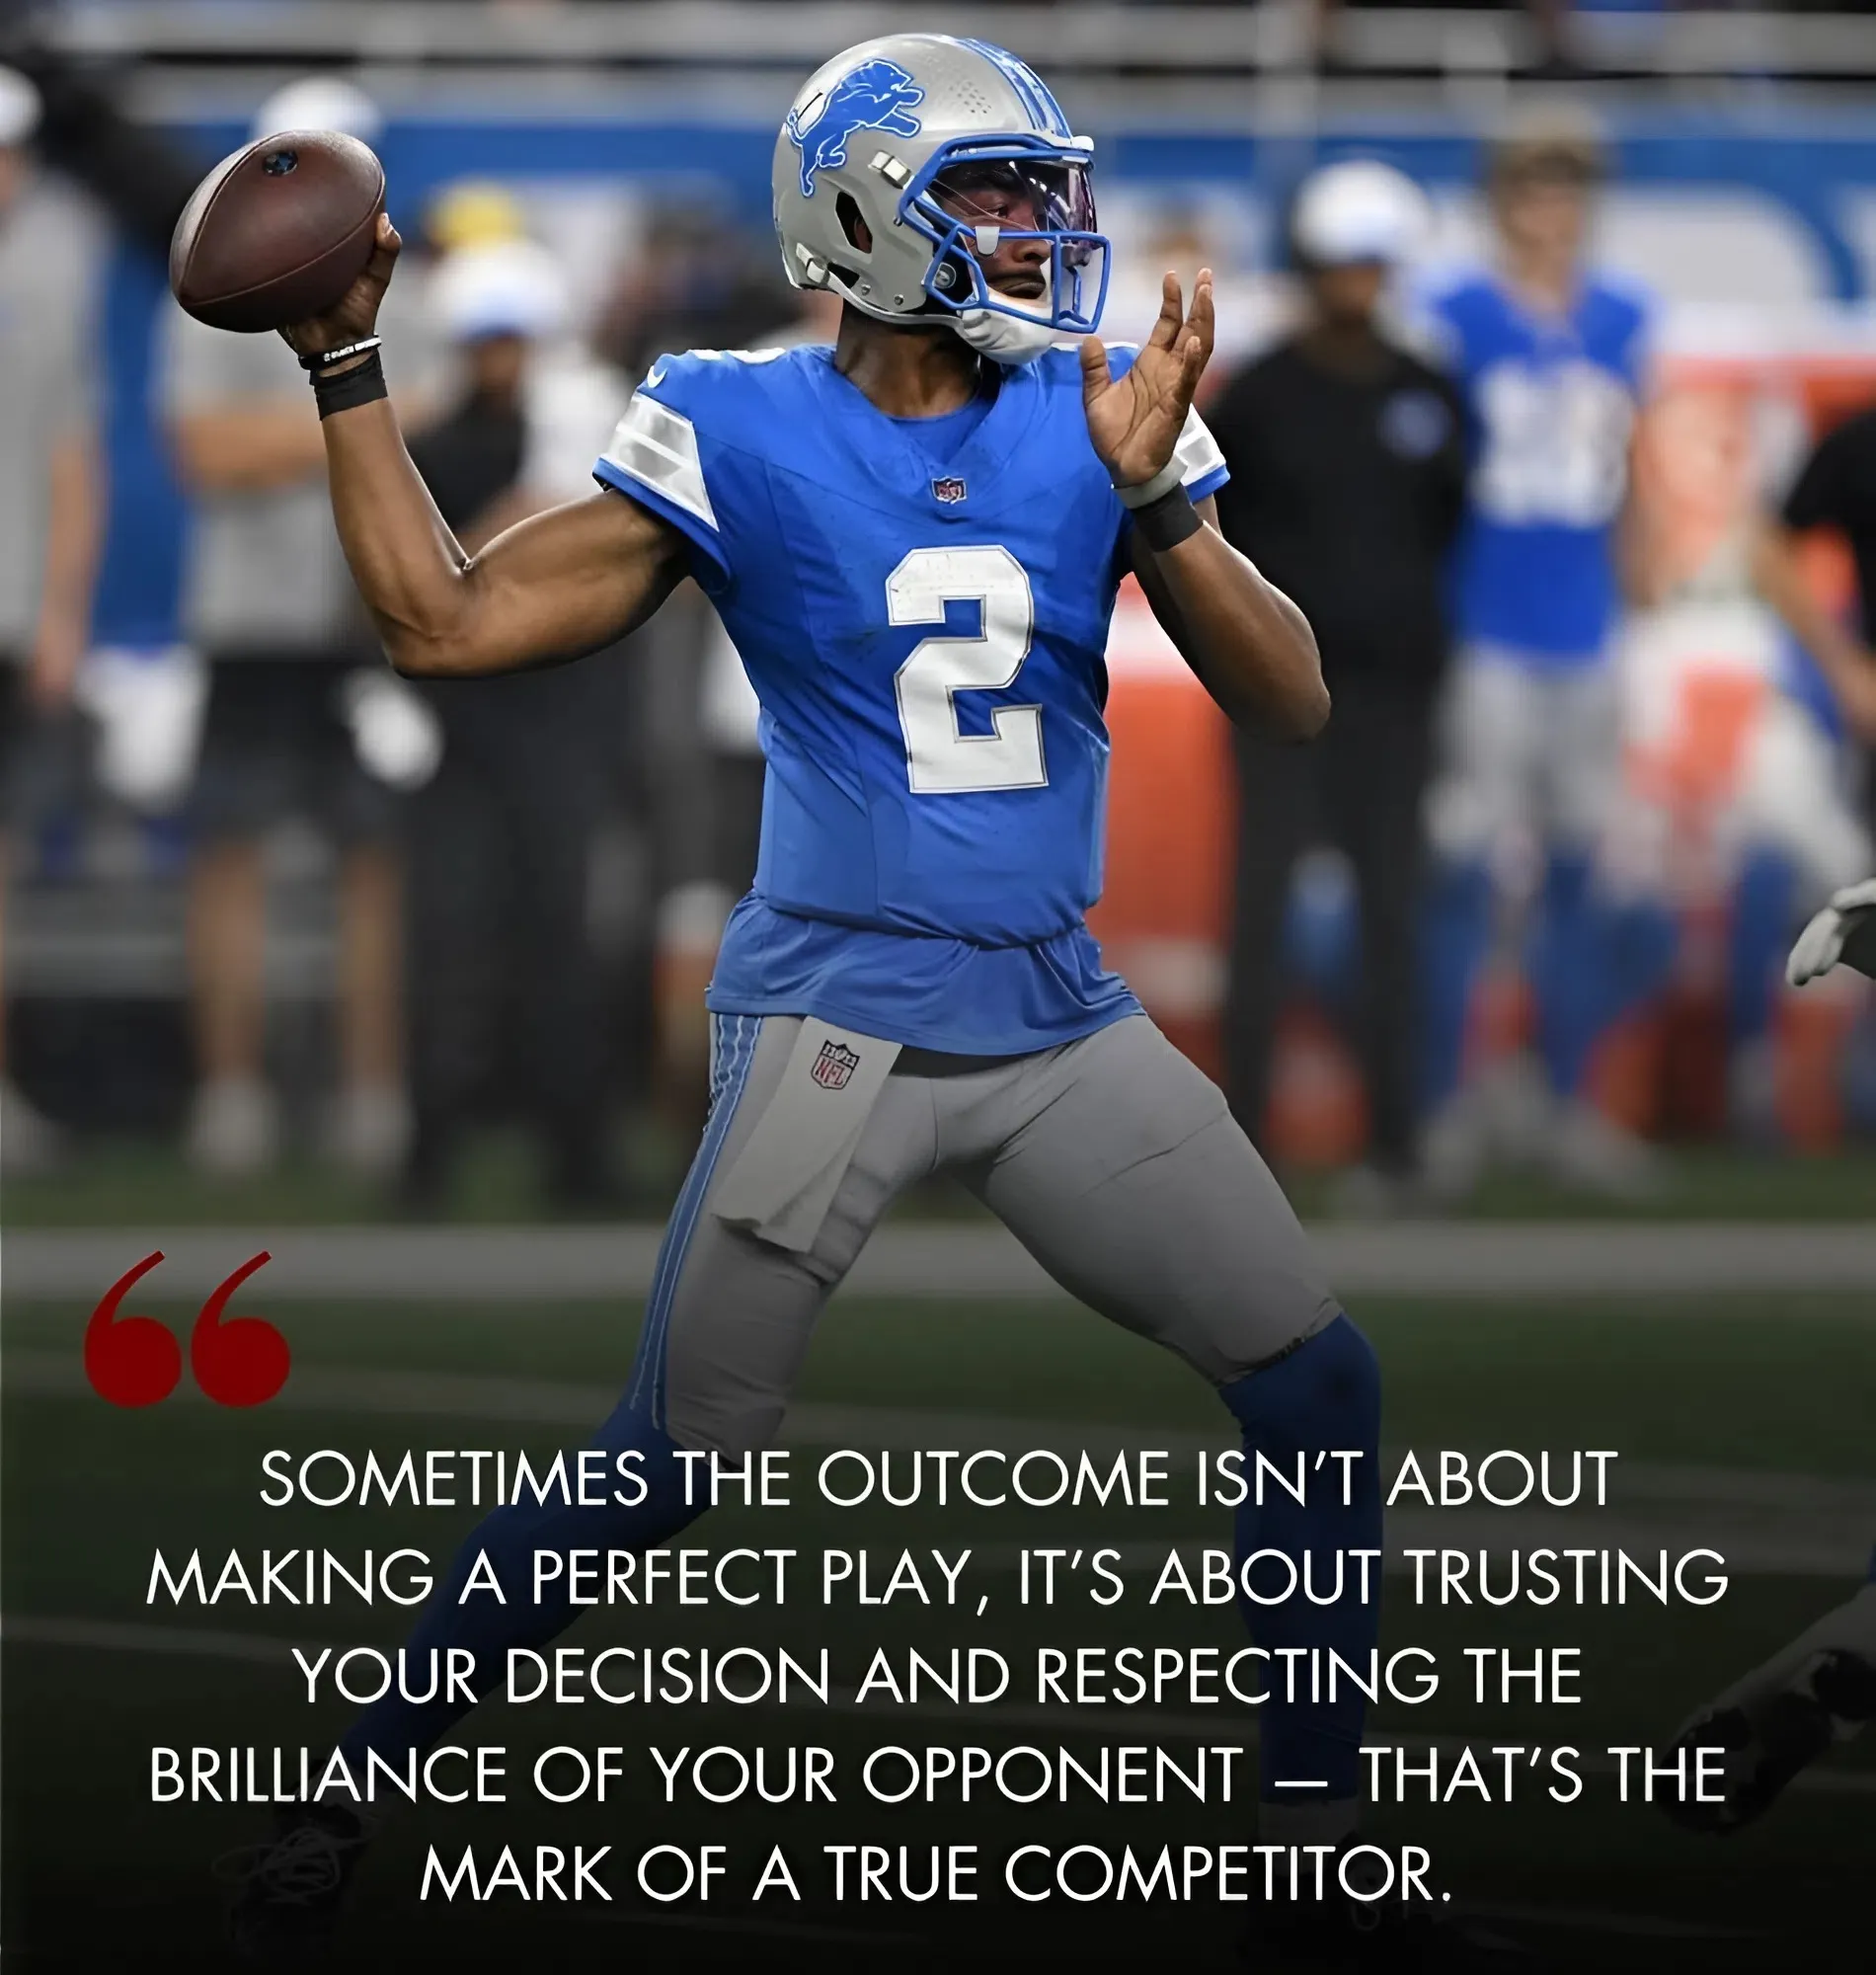
At first these stats didn’t add up. But then Joe did more digging and may have found the culprit.
Handicapper turned stathead Warren Sharp put out a Twitter documenting how many drives each team had last year that ended in either a turnover or a punt.
The Bucs were in the middle of the pack at No. 15. They had 101 drives that ended in either a turnover or a punt. Did that drag down the scoring? Perhaps.
Yet the Bucs ranked No. 20 in the NFL in scoring. So Joe isn’t sure one stat related to the other.
Then Joe decided to do a bit of research on field goals. Did the Bucs attempt too many field goals that would hold back the scoring? Perhaps. The Bucs were No. 8 in the league with made field goals (29).
Curiously, the Bucs were No. 20 in field goal attempts (31). So the Bucs were 20th in both points scored and field goal attempts. A connection? Doesn’t appear to be.
Joe isn’t sure any of these stats suggest any sort of outcome except field goals, maybe. The Bucs were No. 8 in field goals made yet were No. 20 in points scored. Those two stats may be connected.
Perhaps if the Bucs try harder for six points instead of three, they won’t be in the bottom half of the league in points scored?
# of drives ending in a punt or turnover
— Warren Sharp (@SharpFootball) June 1, 2024
68 - DAL
69
70
71
72
73
74
75 - SF
76
77
78
79
80
81
82
83
84 - BUF, GB
85
86 - PHI
87
88 - LAR
89
90 - SEA
91 - BAL
92 - MIA
93
94 - KC, DET
95
96
97
98 - ARI
99 - NO
100 - IND
101 - TB
102 - CHI
103 - MIN, CIN
104 - TEN
105 - JAX, HOU,…